Learn how to read and understand food labels to make healthier choices.
Use these three steps to understand food labels
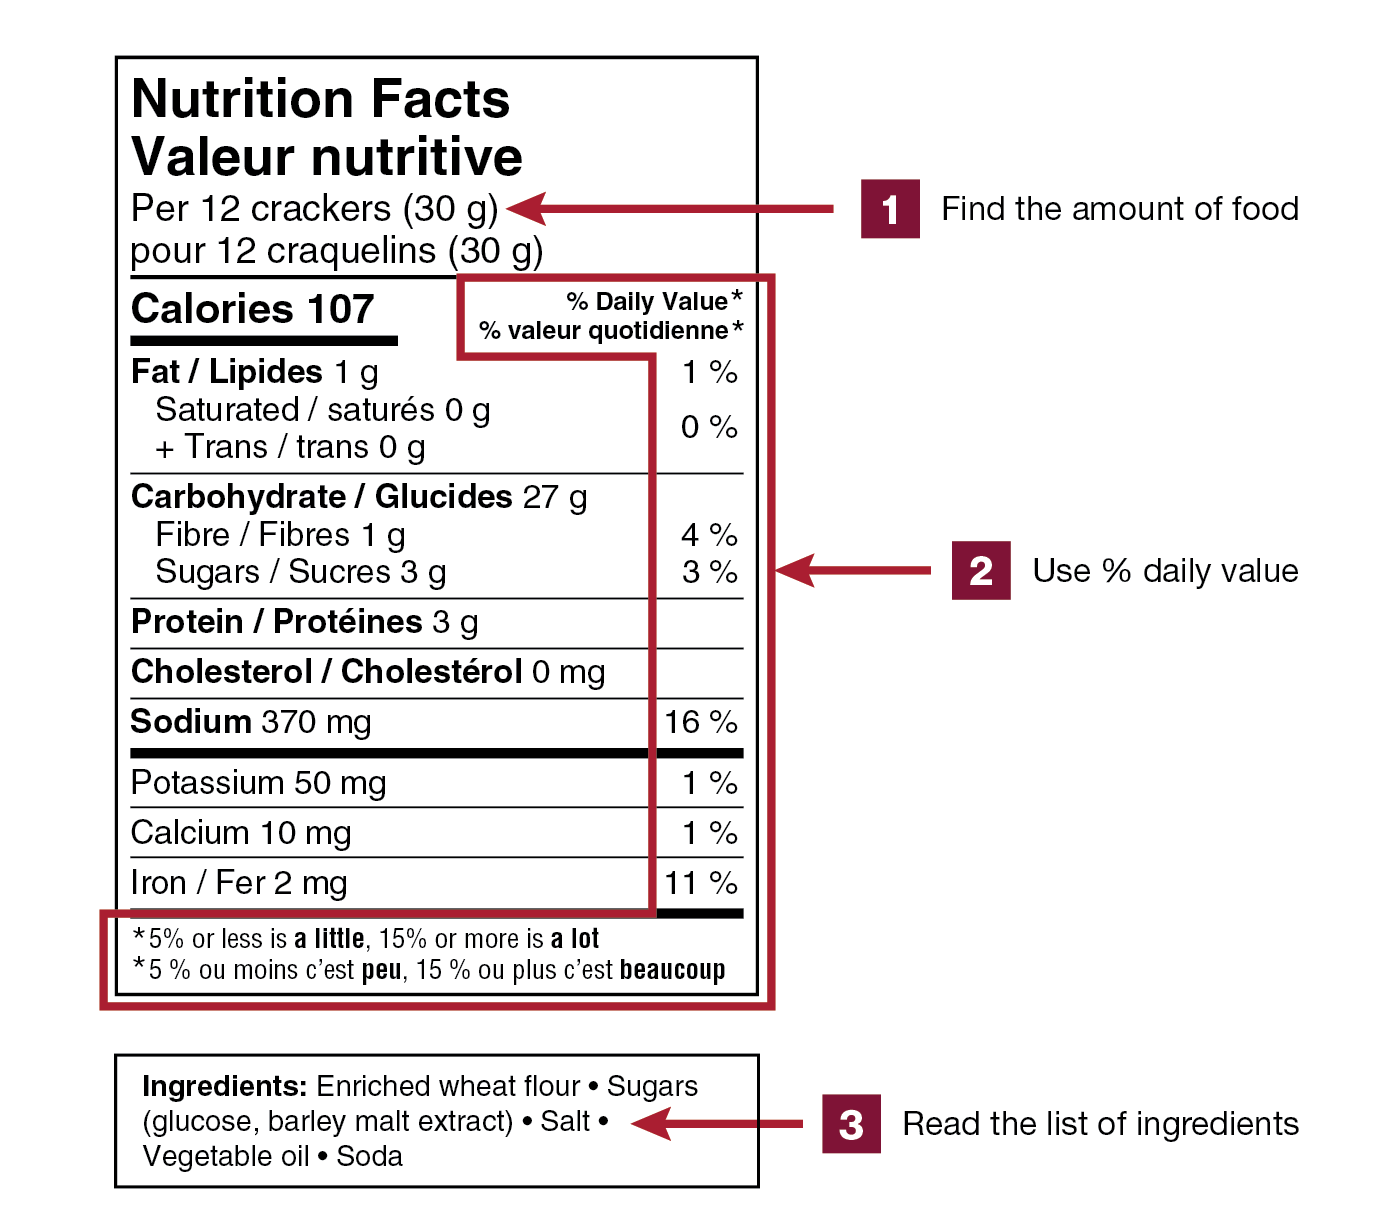
1. Find the amount of food:
The amount of food listed in the nutrition facts table is called serving size. The information in the nutrition facts table is based on this amount of food.
2. Use % daily value:
The % daily value (% DV) tells you if a food product has a little or a lot of a certain nutrient:
- 5% DV or less is a little
- 15% DV or more is a lot
3. Read the list of ingredients:
The list of ingredients lists all of the ingredients in a food product in order of weight. This means that the food product contains:
- more of the ingredients found at the beginning of the list
- less of the ingredients at the end of the list
Figure 1: Three steps to understand food labels
Figure 1 – text description
Shown here is an image of a nutrition facts table and a list of ingredients. The nutrition facts table is positioned on top of the list of ingredients. There is explanatory text to the right of the table and ingredients list with arrows and corresponding numbers pointing to different elements of the nutrition facts table and list of ingredients.
Following is a description of the nutrition facts table.
Left justified at the top of the table is the heading nutrition facts and stacked below it is the heading Valeur nutritive. Both are in bold. The next line is per 12 crackers open parenthesis 30 grams close parenthesis. The next line is pour 12 craquelins open parenthesis 30 grams close parenthesis. There is a thin rule below pour 12 craquelins open parenthesis 30 grams close parenthesis that spans the width of the table. The next line is Calories in bold followed by 107, also in bold. Right justified on the same line is the subheading percent symbol Daily Value in bold. Stacked under this is percent symbol valeur quotidienne also in bold. Both Percent Daily Value and percent valeur quotidienne are followed by an asterisk that refers to a footnote at the bottom of the nutrition facts table. There is a thick rule under the Calories information that ends after the number 107. It does not span the width of the table.
Left justified on the next line is Fat, forward slash, Lipides, in bold, followed by 1 and a lowercase g. Right justified on the same line is the number 1 followed by a percent symbol. Indented on the next line is Saturated, forward slash, saturés followed by 0 and a lower case g. Indented on the next line is a plus symbol followed by Trans, forward slash, trans followed by 0 and a lowercase g. Right justified and vertically centered against the saturated and trans information on the left is 0 followed by a percent symbol. There is a thin rule below the trans information that spans the width of the table.
The next line is Carbohydrate, forward slash, Glucides, in bold, followed by 27 and a lowercase g. Indented on the next line is Fibre, forward slash, Fibres, followed by 1 and a lowercase g. Right justified on the same line is a placeholder for percent Daily Value of Fibre followed by 4 and a percent symbol. Indented on the next line is Sugars, forward slash, Sucres, followed by 3 and a lowercase g. Right justified on the same line is the number 3 followed by a percent symbol. There is a thin rule under the sugars information that spans the width of the table.
The next line is Protein, forward slash, Protéines, in bold, followed by 3 and a lowercase g. There is a thin rule under the protein information that spans the width of the table.
The next line is Cholesterol, forward slash, Cholestérol, in bold, followed by 0 and mg in lowercase. There is a thin rule under the cholesterol information that spans the width of the table.
The next line is Sodium, in bold, followed by 370 and mg in lowercase. Right justified on the same line is 16 followed by a percent symbol. There is a thick rule under the sodium information that spans the width of the table.
The next line is Potassium followed by 50 and mg in lowercase. Right justified on the same line is 1 followed by a percent symbol. There is a thin rule under the potassium information that spans the width of the table.
The next line is Calcium followed by 10 and mg in lowercase. Right justified on the same line is 1 followed by a percent symbol. There is a thin rule below the calcium information that spans the width of the table.
The next line is Iron, forward slash, Fer followed by 2 and mg in lowercase. Right justified on the same line is 11 followed by a percent symbol. There is a thick rule under the iron information that spans the width of the Nutrition Facts table.
The next two lines is the percent Daily Value footnote that was referred to at the beginning of the table description. The footnote starts with an asterisk followed by the statement: 5 percent symbol or less is a little,15 percent symbol or more is a lot and on the second line is an asterisk followed by the statement: 5 percent symbol ou moins c’est peu, 15 percent symbol ou plus c’est beaucoup. The terms ‘a little’, ‘a lot’, ‘peu’, and ‘beaucoup’ are in bold. This is the end of the new Nutrition Facts table.
Following is a description of the list of ingredients.
There is a white box outlined by a black rule. All text inside the box is black with the first letter of each ingredient capitalized. A bullet separates each ingredient in the list. There are 3 lines of text that run horizontally within the box.
The first line starts with the word Ingredients, in bold, followed by a colon. This is followed on the same line by Enriched wheat flour, followed by a bullet, followed by Sugars.
The next line starts with an open parenthesis, glucose, followed by comma, barley malt extract, close parenthesis. The parenthesis is followed by a bullet, followed by Salt.
The last line in the box starts with the word Vegetable oil, followed by a bullet, followed by Soda.
There is text shown on the outside of the nutrition facts table and list of ingredients to the right with arrows pointing inwards. This is described below.
Starting at the top right, there is an arrow pointing to the serving size information followed by a burgundy square box with a number 1 in the middle in white. The number is bold. To the right of this is which text which says: Find the amount of food using the serving size.
Below this, there is an arrow pointing to the 3 percent symbol on the sugars line followed by a burgundy square box with a number 2 in the middle in white. The number is bold. To the right of this is which text which says: use percent daily value. Accompanying this step is a bold burgundy border that goes around the percent daily value, column of numbers and percentages under the % daily value title and footnote regarding 5 vs 15%.
At the bottom right, in line with the ingredients list, there is an arrow pointing to the salt in the ingredients list followed by a burgundy square box with a number 2 in the middle in white. To the right of this is which text which says: read the list of ingredients.
This is the end of the description.
Make a healthier food choice
When making a food choice or comparing two similar food products, choose those with less:
- sugars
- sodium
- saturated fats
Some nutrients you may want more of include:
- iron
- fibre
- calcium
- potassium
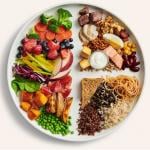
The nutrients you may want more of are often found in foods that do not have a nutrition facts table, such as many vegetables and fruits. Canada’s food guide recommends eating plenty of vegetables and fruits, whole grain foods and protein foods to help meet your nutrient needs.
Canada’s food guide also recommends:
- Limiting your intake of highly processed foods and drinks that add excess sodium, sugars or saturated fat to your diet.
- Using food labels to make healthier food choices.


